Deciphering the Acronyms
Behold, the Technical Analysis, aka “DREAM TEAM SAID X” (rolls of the tongue better than TEMA-DEMA-RSI-ADX and still includes all the letters!)
Jokes aside, this is the true workhorse behind the NASDUCK analysis. That’s why you see it so often! We've got two key views here: long-term (90 days) and short-term (720 hours, or about 30 trading days). Here's how to read these charts like a pro:
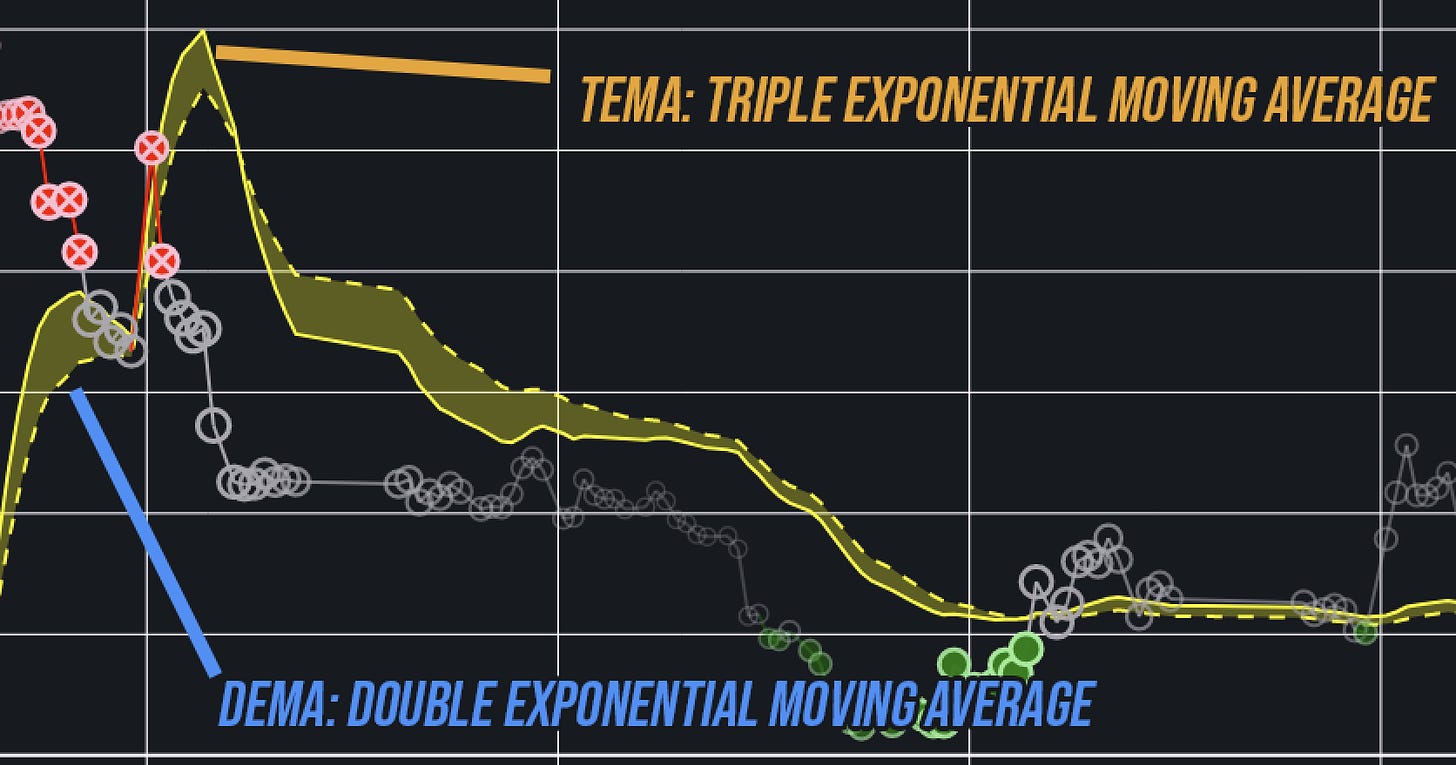
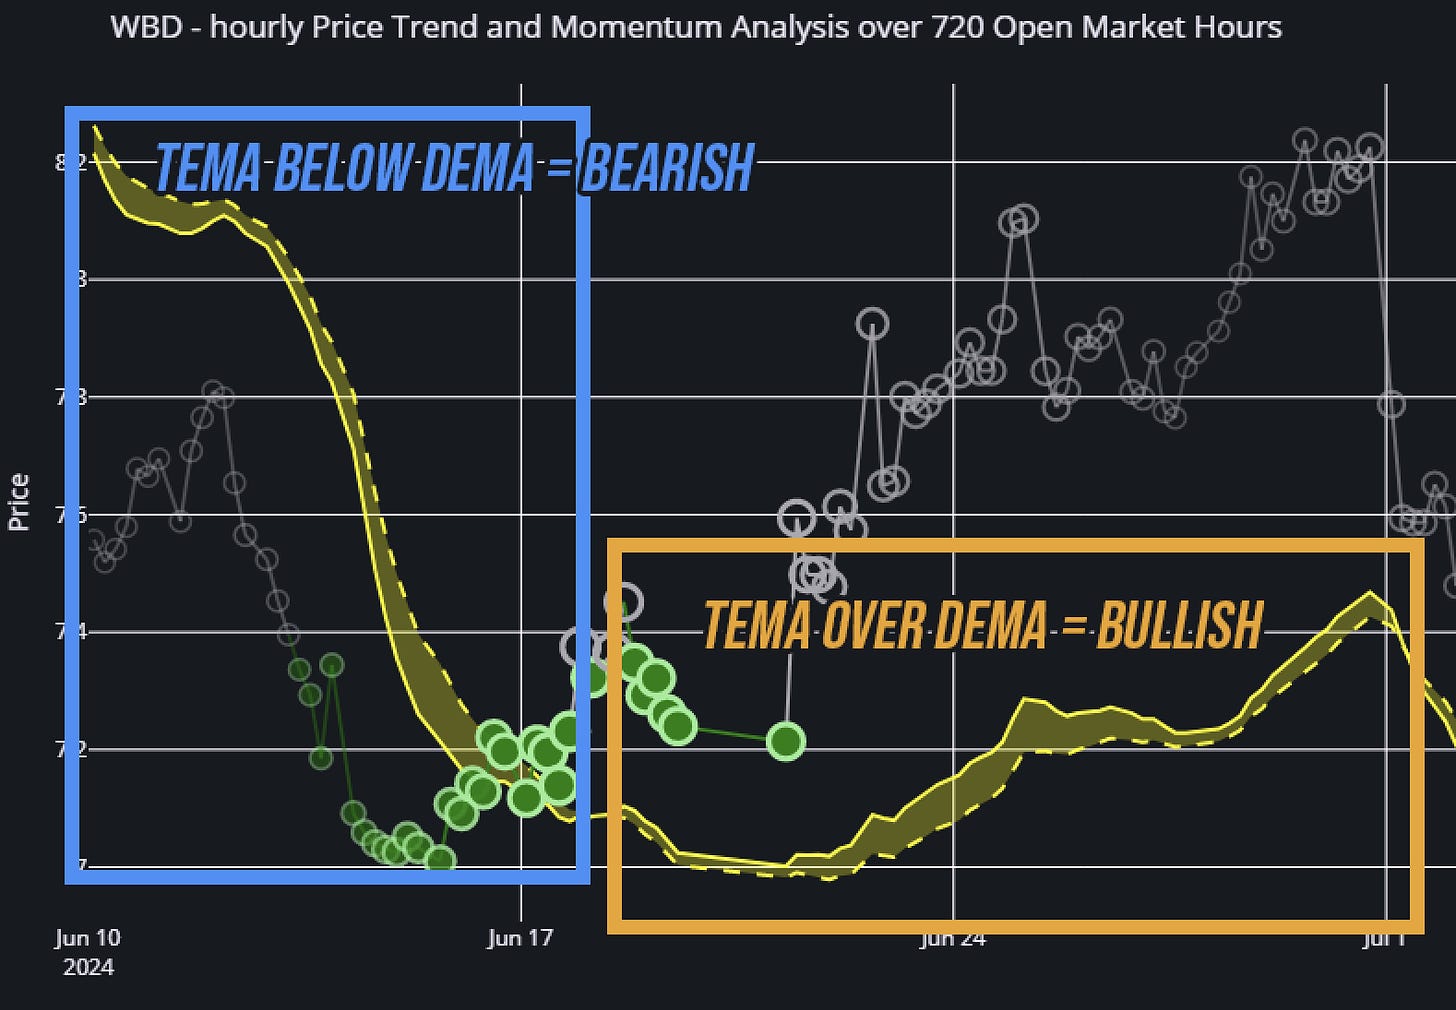
TEMA and DEMA - (T)riple and (D)ouble (E)xponential (M)oving (A)verages. Think of them as the market's twin mood rings, but actually useful. They both smooth out price data but are more responsive to recent price changes than a simple moving average. DEMA is more excitable of the two. It's great for spotting trend reversals, but like that one friend who always jumps to conclusions, it can give false alarms in choppy markets.
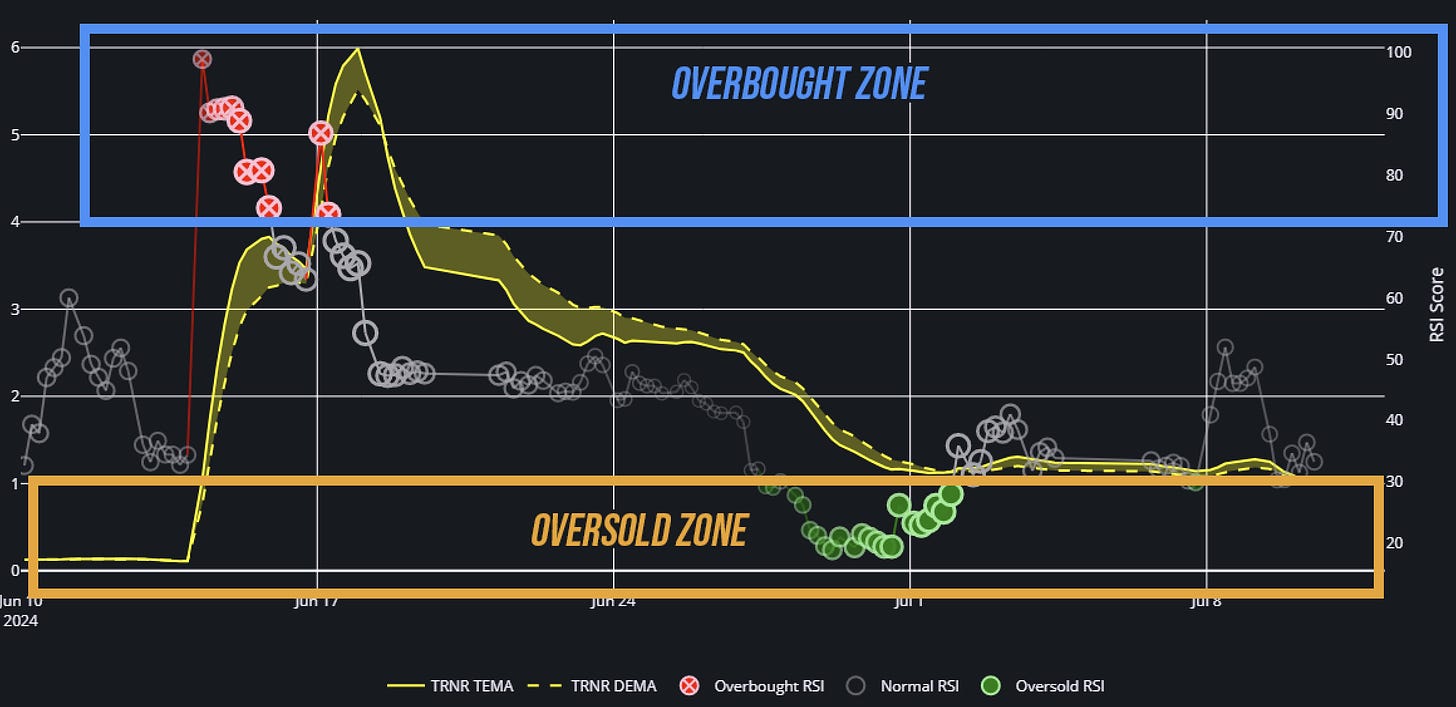
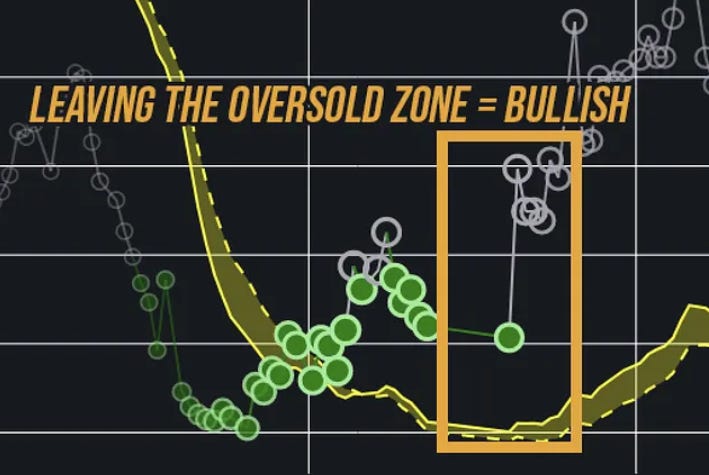
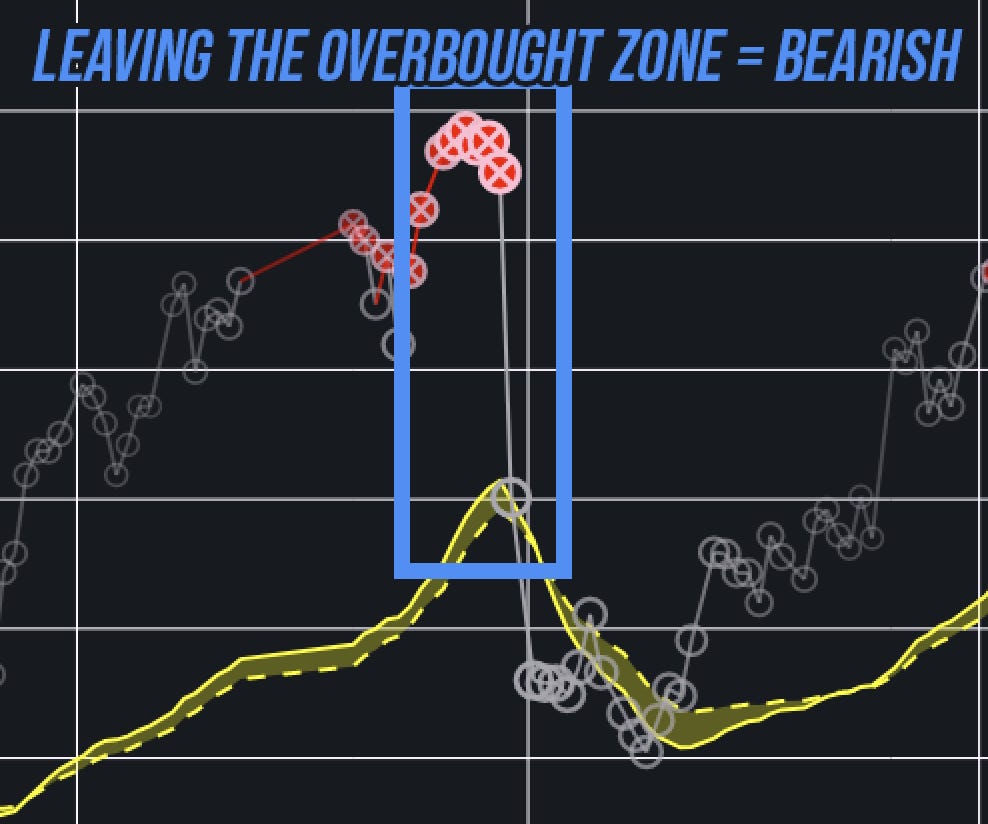
RSI (Relative Strength Index) - Think of it as a pressure gauge for the market that tells you if something seems overbought or oversold. It compares the magnitude of recent gains to recent losses. It doesn't guarantee a breakdown, but it sure tells you when to pay attention.
Red dots mean overbought: Potential sell signals.
Grey dots suggest neutral territory: The market's just chillin'.
Green dots stand for oversold: Potential buy signals.
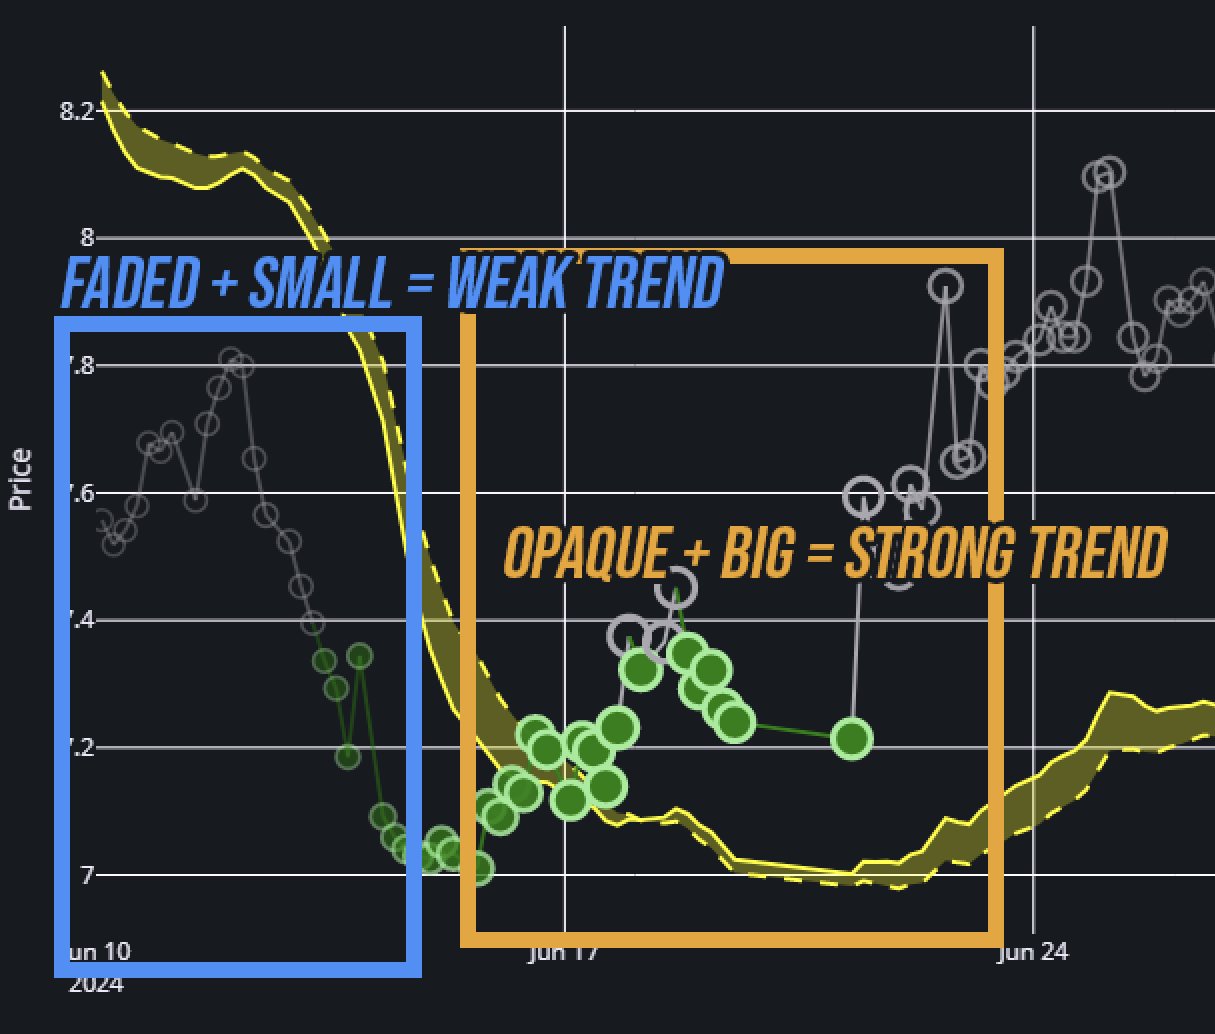
ADX (Average Direction Index) is the market's conviction meter that supplements RSI. It tends to light up when the market seems determined to keep pushing. trend-following strategies might work well.
ADX shows up as dot size and line thickness.
The bigger the dots, the more visible they are, the stronger the trend.
Cracking the Code
I’m a long-term kind of guy, but I think any trader would be wise to double check by consulting both long-term and short-term charts.
Bullish Signals 🟩
Price jumps above the yellow zone
TEMA is above DEMA
RSI moves up from oversold (green) to neutral (grey) with big bright dots
Bearish Signals 🟥
Price drops below the yellow zone
DEMA above TEMA
RSI moving from overbought (red) to neutral (grey) + big bright dots.
Consolidation 💤
Price bouncing between TEMA and DEMA like a ping pong ball
RSI hanging out in the neutral zone
Weak trend: small faded dots
My Strategy for the DUQQQ ETF-like Portfolio
Keep reading with a 7-day free trial
Subscribe to NASDUCK to keep reading this post and get 7 days of free access to the full post archives.


